Prediction
Dealing with Missing Data
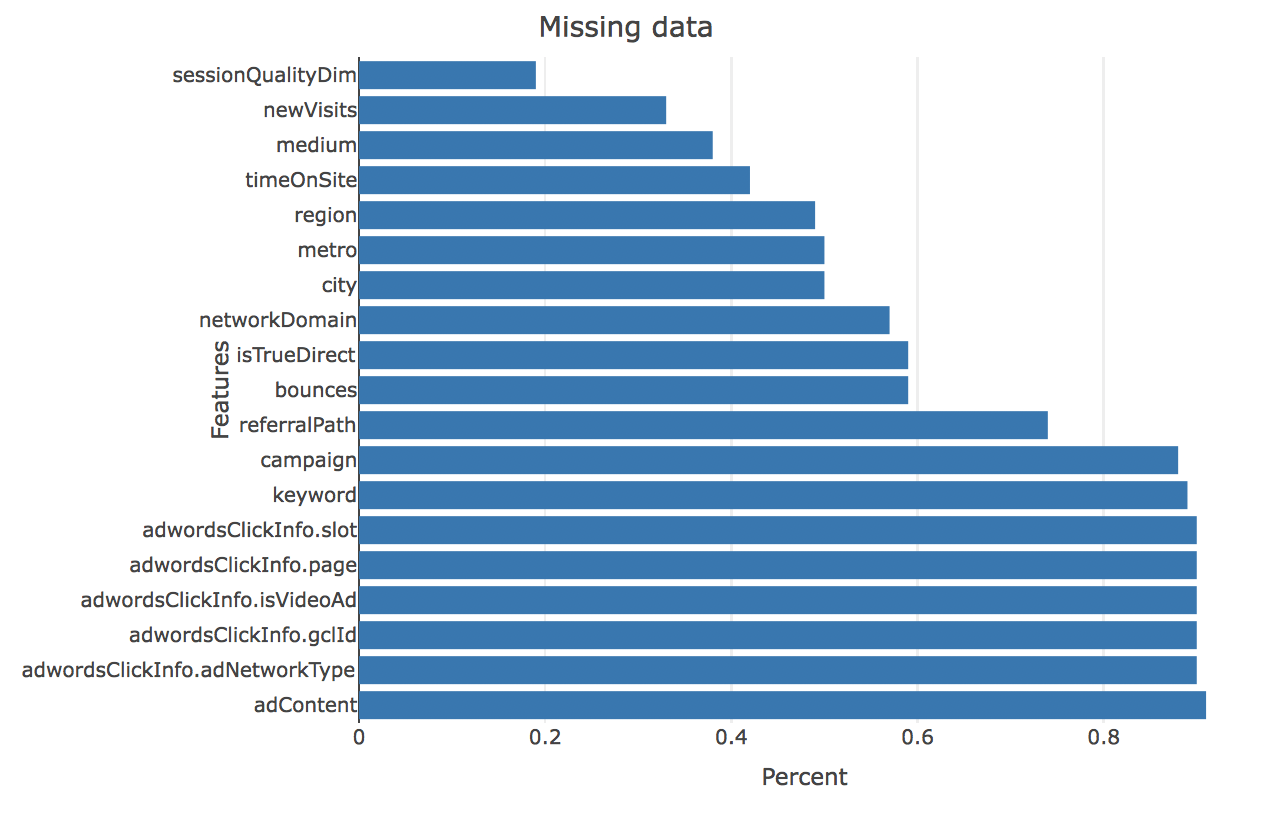
By the EDA, we find that there are a large porpotion amoung of missing data, so the method we use is that if there exists a missing data, we set that data to be zero, and then, for the data of character form, we transform it into factor, and for the factor data, we just flatten it into several 0 and 1 columns.
Feature Correlation Exploration
For the prediction task, we first study the correlation between different variables. Then, the correlation between the variable transactionRevunue and other explanatory variables are shown. We display the top 10 variables which have the highest positive correlation and the top 10 variables which have the highest negative correlation.
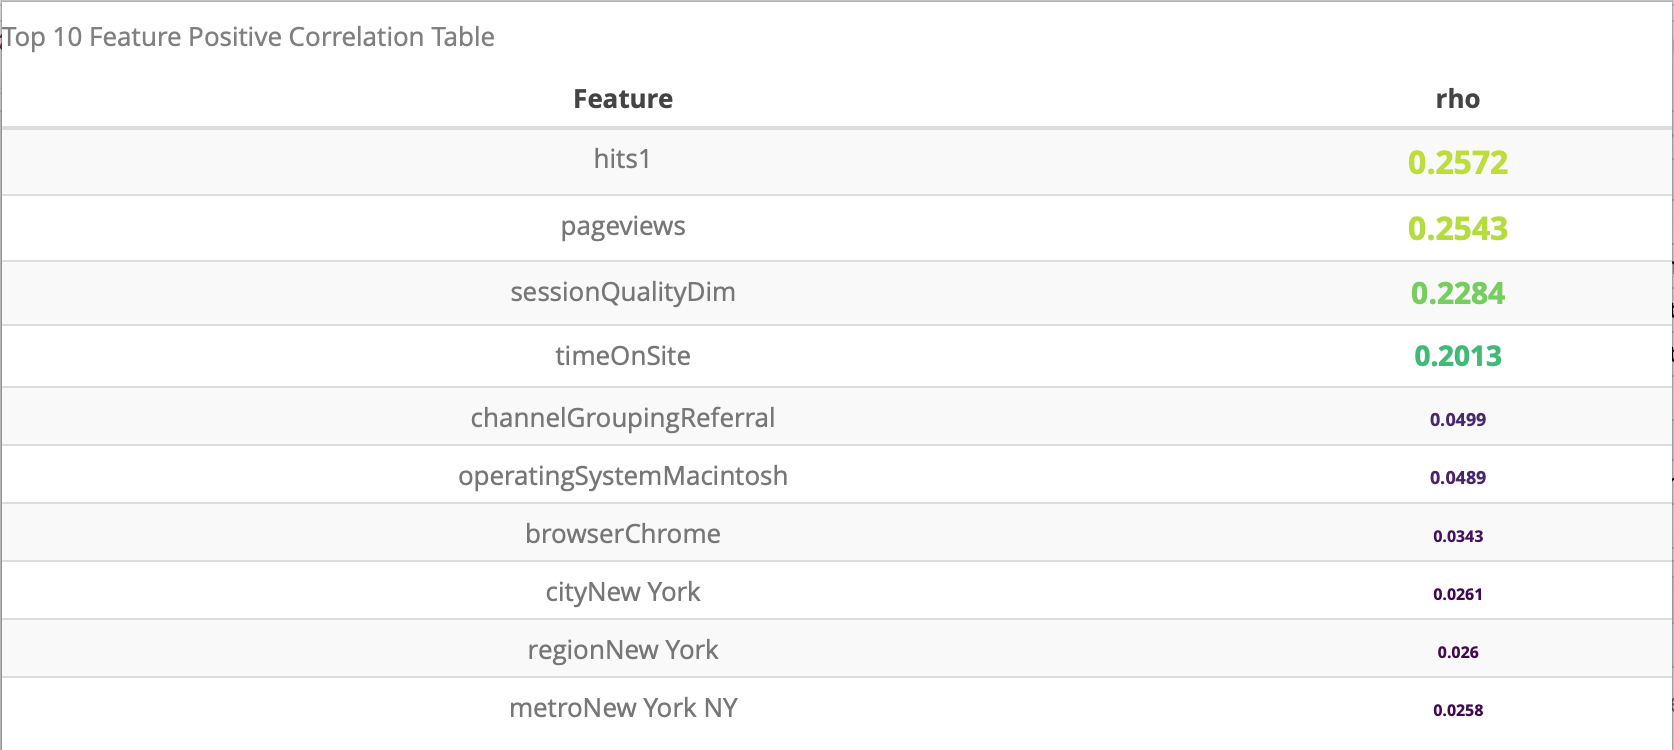
The result shows that the varialbe hits1, pageviews, sessionQualityDim and timeOnSite have correlation significantly larger than the other variables, which also correspond to our intuition.

The result shows that the variable bounces, newVisits, isTrueDirect, isMobile has the largest negative correlation with the variable transactionRevenue.
Predition Method
To predict the transactionRevenue, we apply five different prediction method, Linear Regression, Logistic + Linear Regression, Deep Learning, Lasso and XGBoost. The detailed implementation is illustrated below.
-
Linear Regression: For the Linear regression method, we directly apply the linear regression to regress the log(transactionRevenue + 1) varaible to other explanatory variables and measure the mean sqaured error(MSE).
-
Logistic + Linear Regression: For the Logistic + Lienar Regression method, we develop a two stage method, the first step is fit a logistic regresssion to predict whether the customer will buy the certain products, if the prediciton result is false, the the transactionRevenue for that customer is 0, else we continue use the linear regression trained on the customers who buy the products to predict that the transactionRevenue will be. Then, we compute the MSE for the prediction.
-
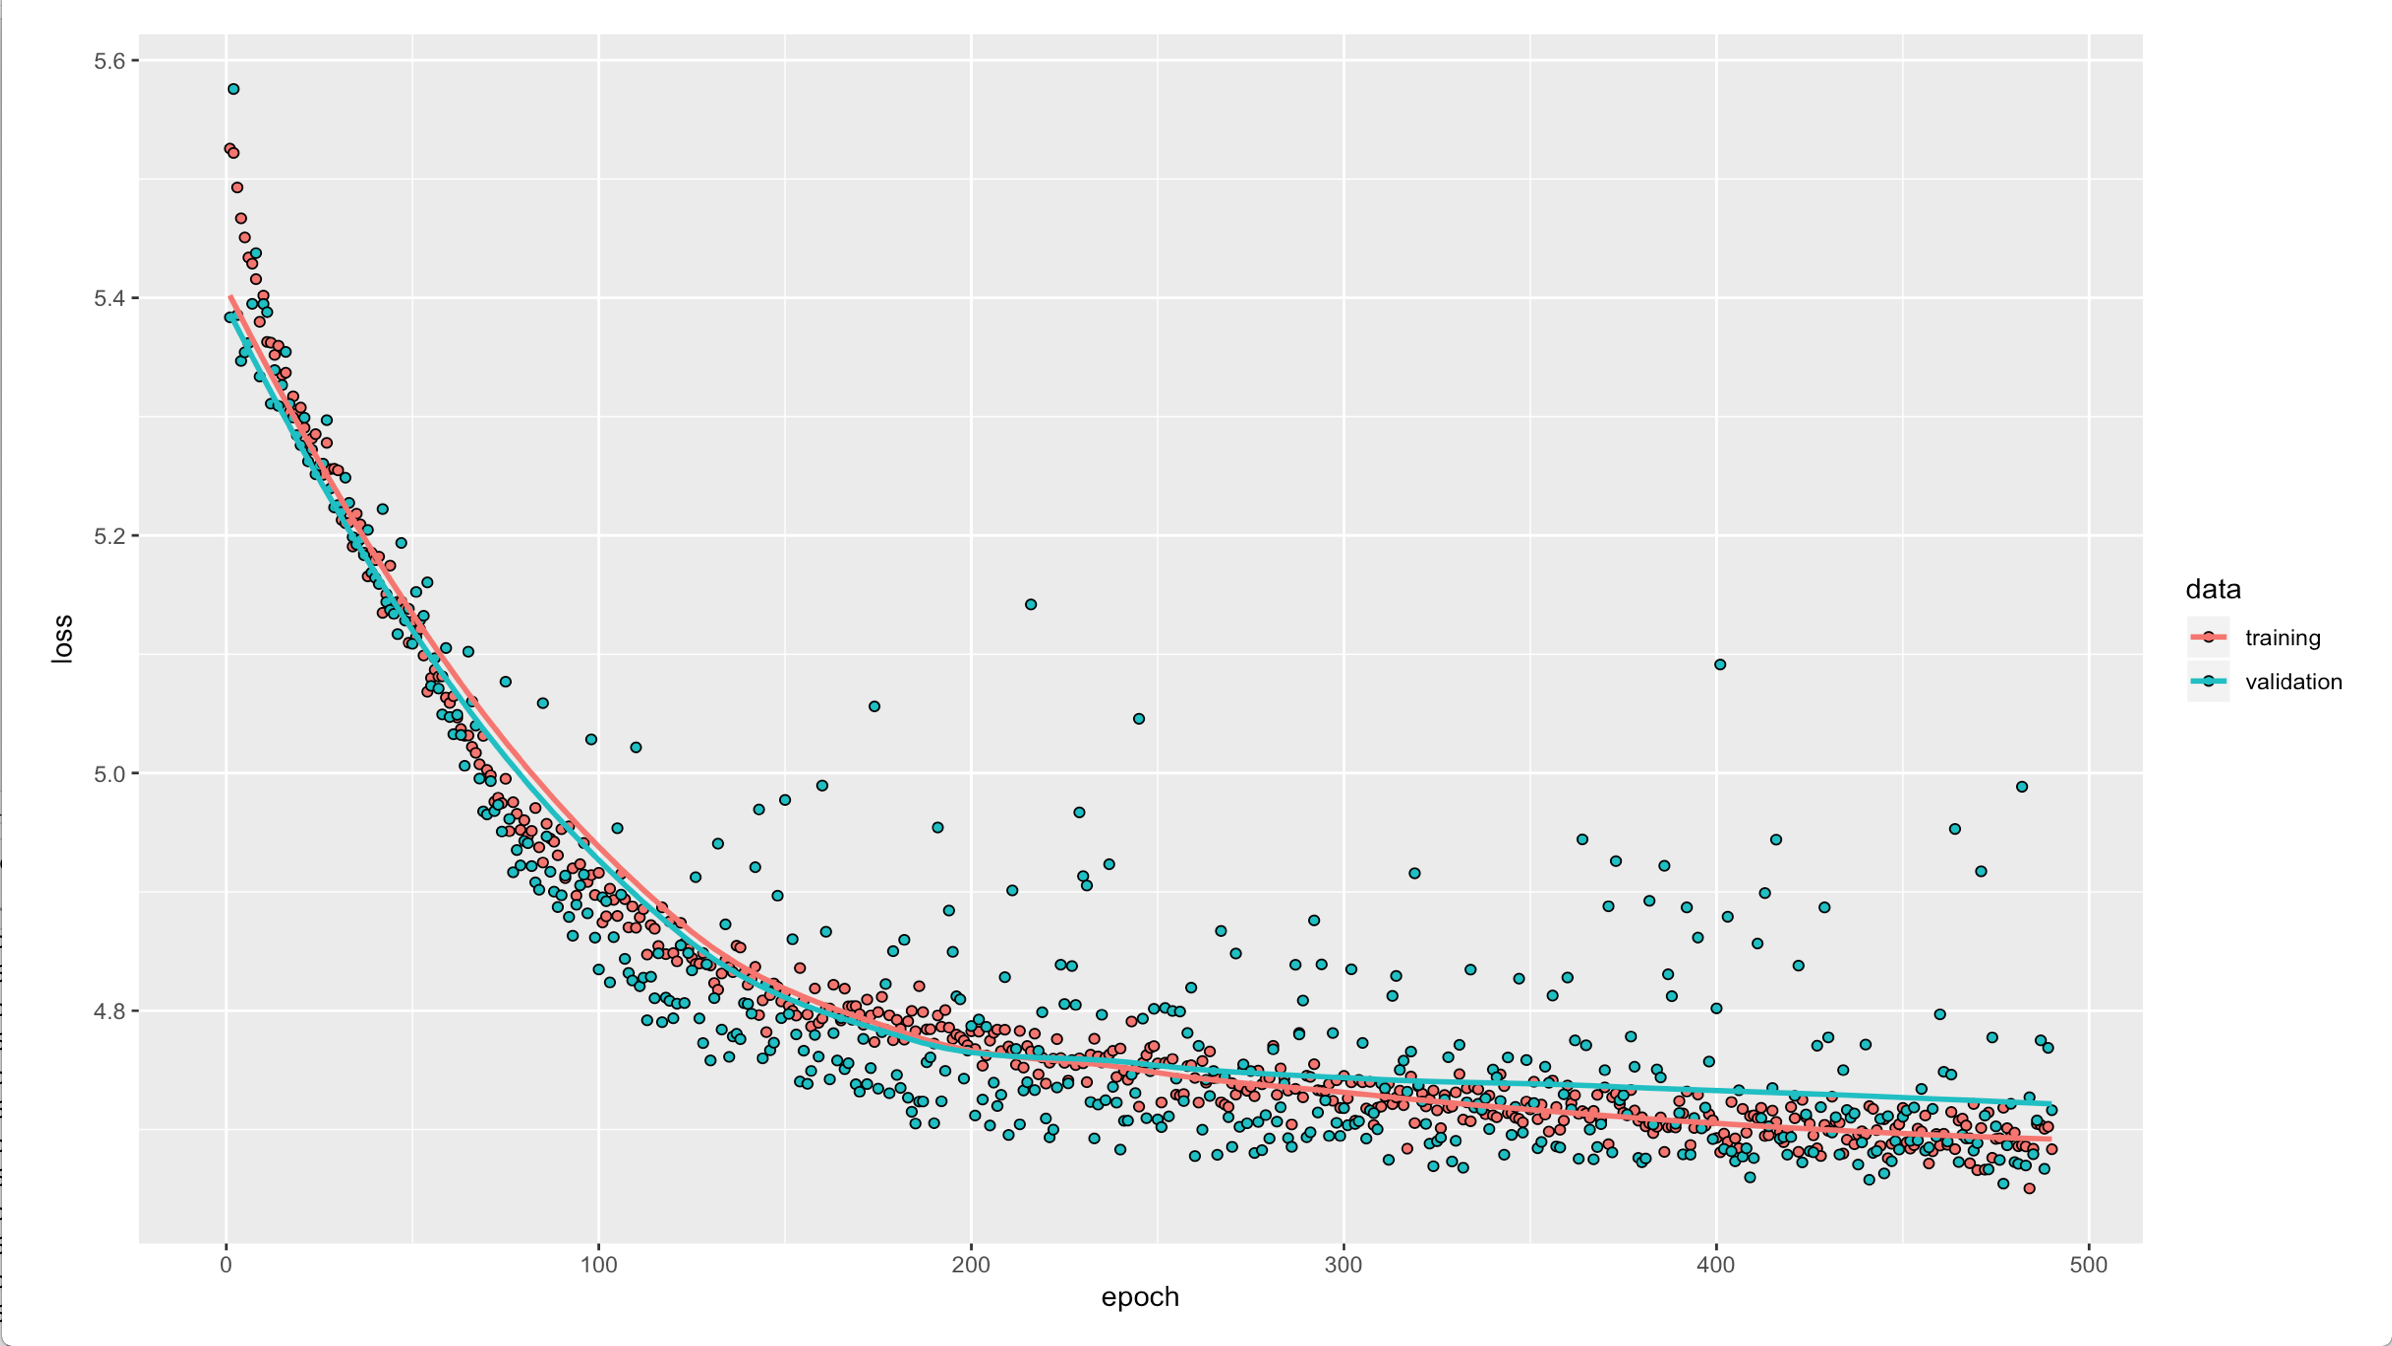
Deep Learning: For the Deep Learning, we use R keras to do the training, the structure of the model is “Input -> Dense(32, activation = “Relu”) -> Dropout(rate = 0.1) -> Dense(16, activation = “Relu”) -> Dropout(rate = 0.1) -> Dense(1, activation = “Linear)”. The optimizer use is rmsprop and training with 500 epochs for the use here. The training process is shown below
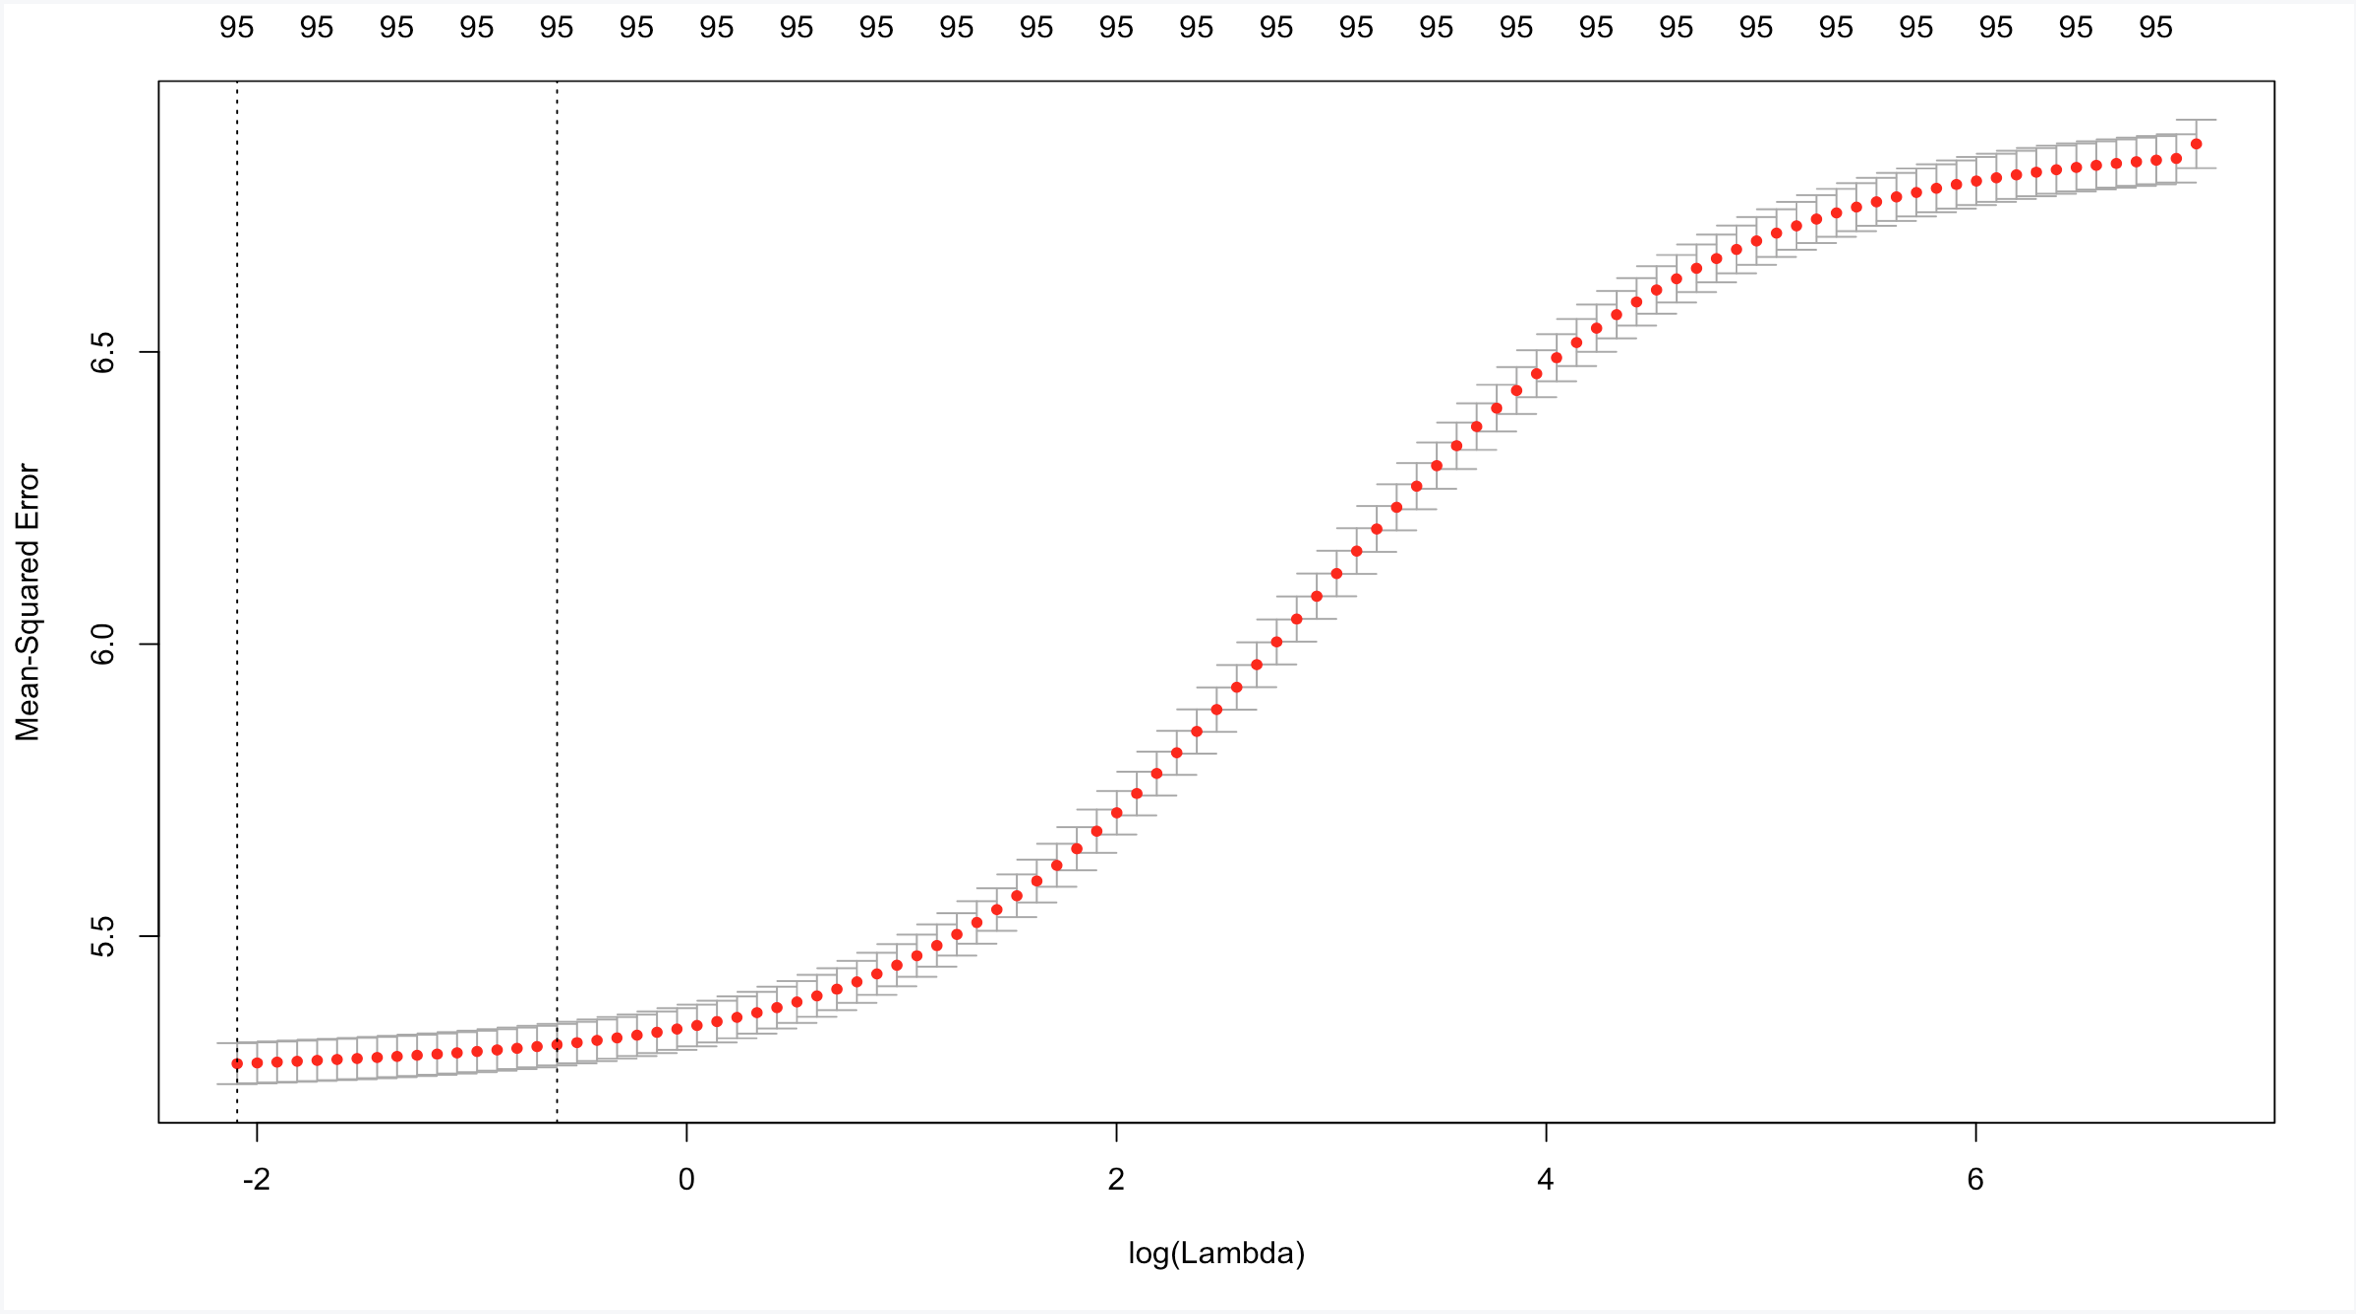
- Lasso: For the Lasso predicition, we use the glmnet package, to apply the lasso, we first flatten the matrix to make factor columns into 0 and 1 columns and then scale the explanatory variables, the cv.glmnet function is then used to do the prediction. The lambda which has the lowest validaiton error is used to fit the final modle and do the prediction. The relationship between MSE and lambda is shown below.
- XGBoost: For the XGBoost method, we use the XGBoost package, here we use the gblinear booster when a total rounds less than 2000.
Prediction Result
Based on the five predicitons, we plot the relationship between MSE and prediction method.
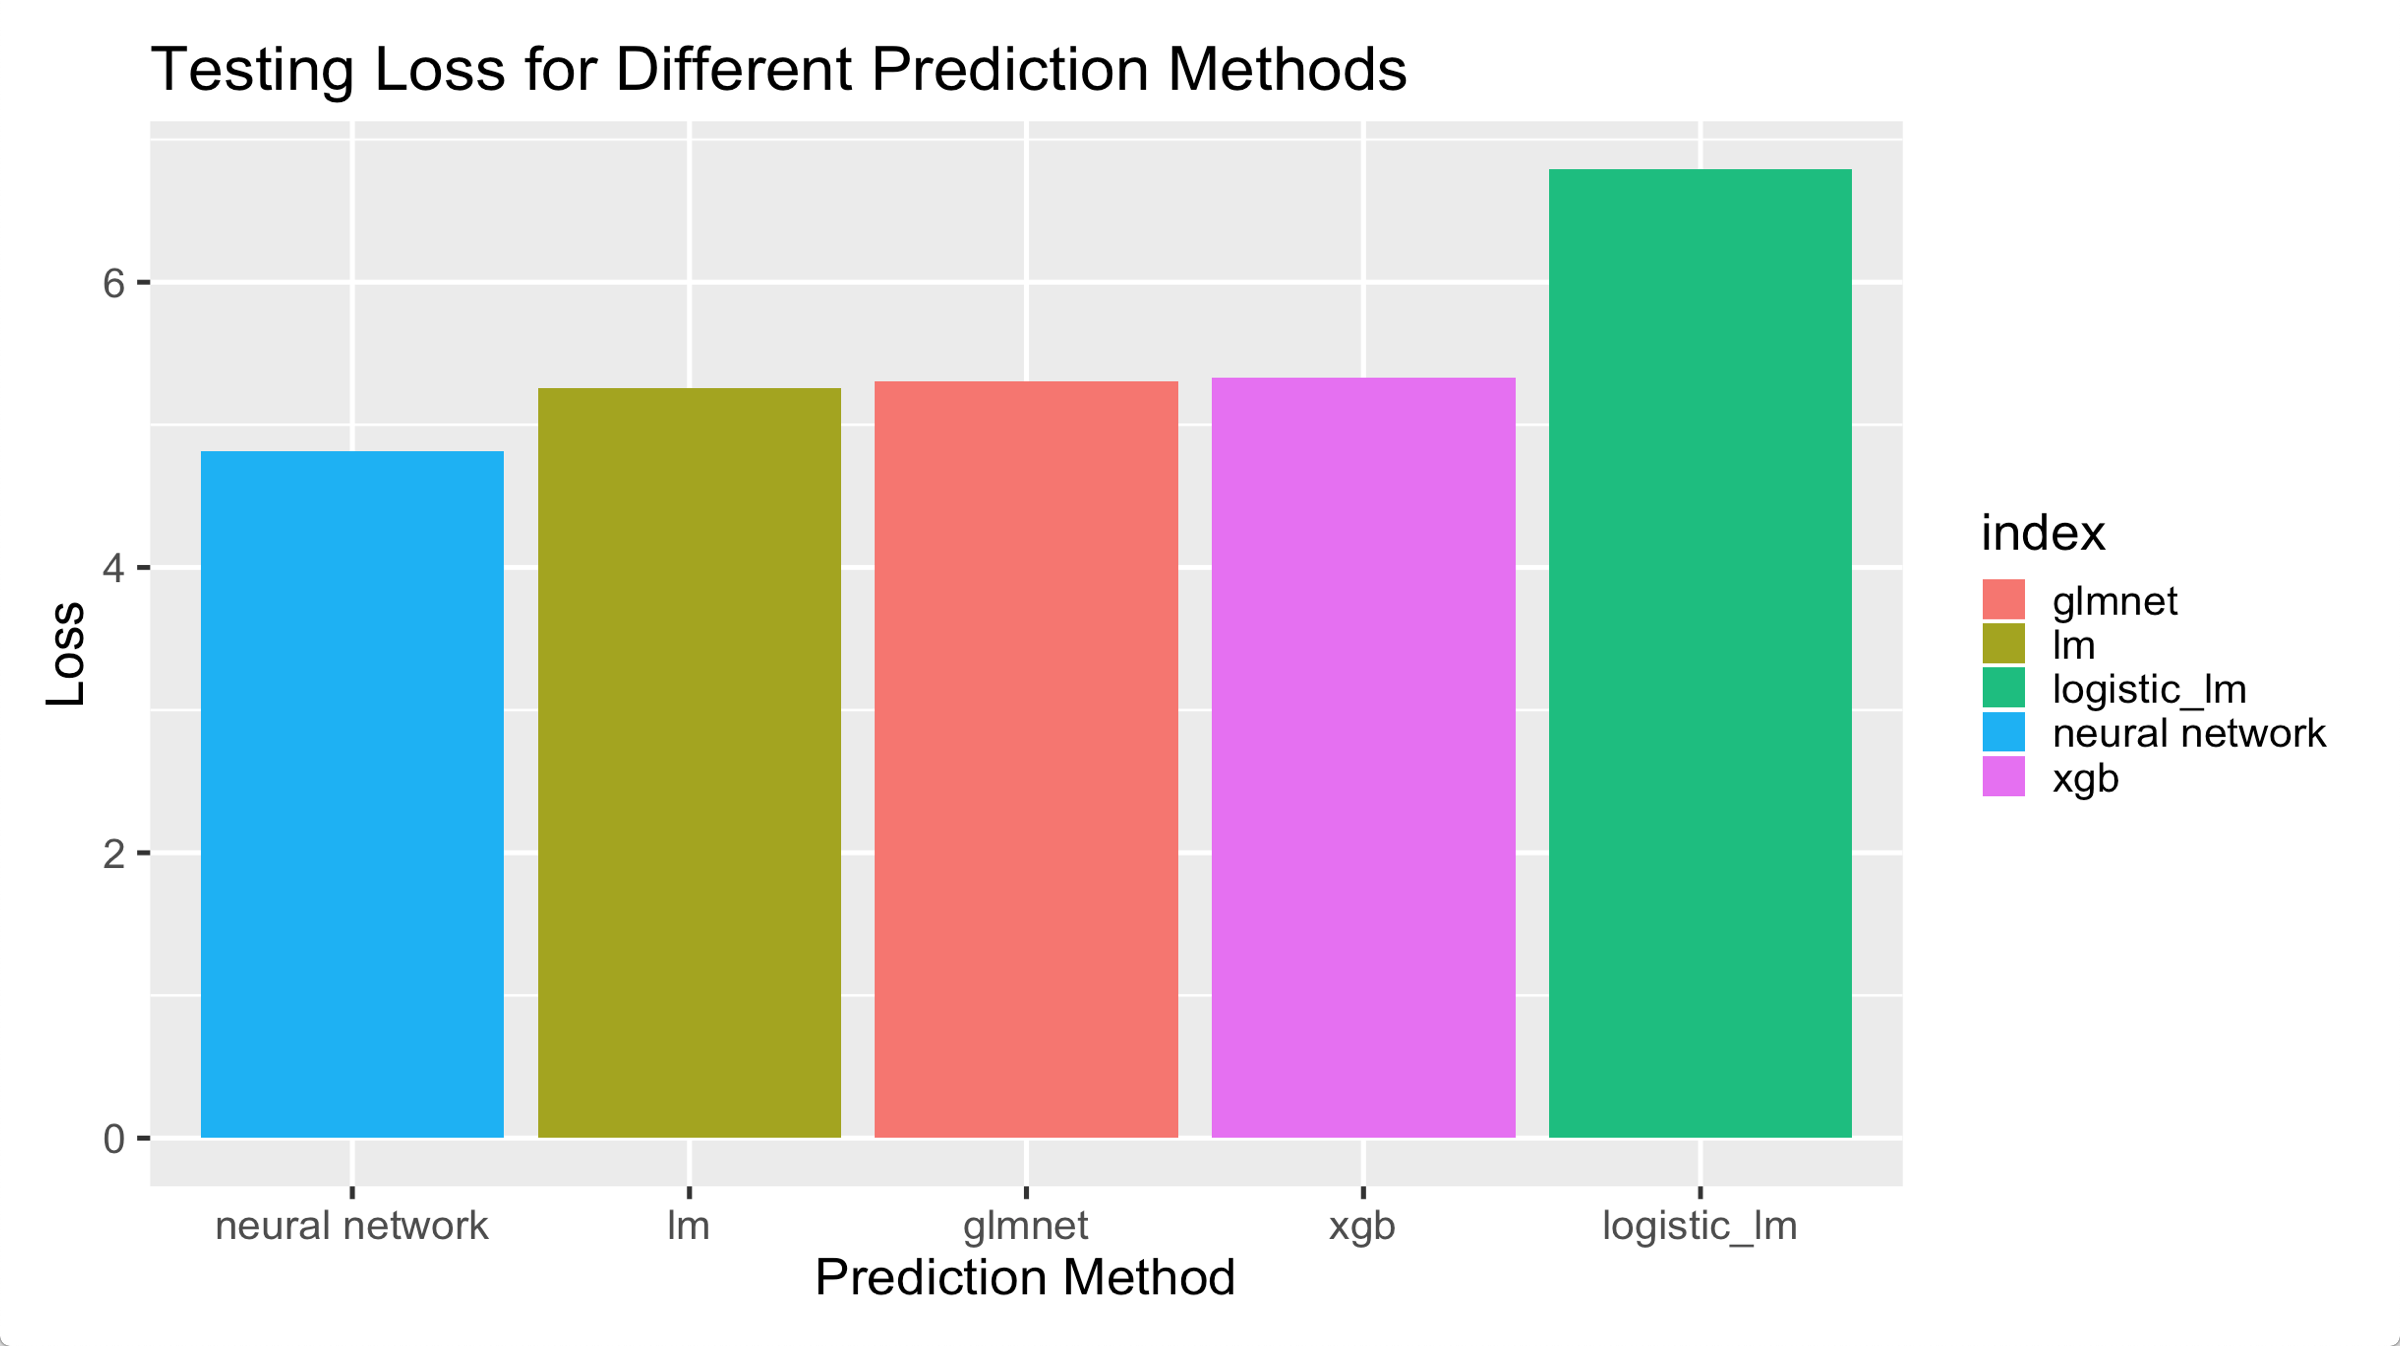
Deep Learning outperforms all the other methods by a margin. Linear Regression, Lasso and XGBoost has similar performance which may be accounted for the reason that the samples size is much larger than the number explanatory variables that variable selection is useless is this problem. Logistic + Lienar Regression performs worst, which may be for the reason that the logistic regression predicts poorly for whether the customer will buy or not.
Combination both Raw and Summary Data
In addition to the prediction above which uses only the raw data, we also use the summary data.
Hits data (delete all columns directly related to transaction record) from the analytic API encodes all detailed web pathes and actions along whole visiting of every visitor, which then will be nested and have multiple rows for every visitor.
To predict for each individual not each web visit (also we don’t have visit based revenue data). We need to extract some features for each visitor. We do this from detailed exploring the transaction behavior.
After exploring the behavior, we reduced the nested dataset and extract features which aims to count every meaningful type of web action and also give information to time consumed to a page and price quantiles for goods visitor took action on.
Then as in the html, these part of data is already useful and doing a random forest make the loss be arround 3.5
Then we try to finalize our model, we combine two data by ID and then choose a randomForest because some feature has lots of levels and there are lots of features. And bagging based randomForest is natural to resist overfitting.
We also use the finding that visitor just viewing the content will not make transaction. This will role out about 2/3 of the data (we directly predict them as 0). And they we train the model in remaining data which might assist (but not quite for a tree based model) the power of the training. And the results and the feature importance is as in html
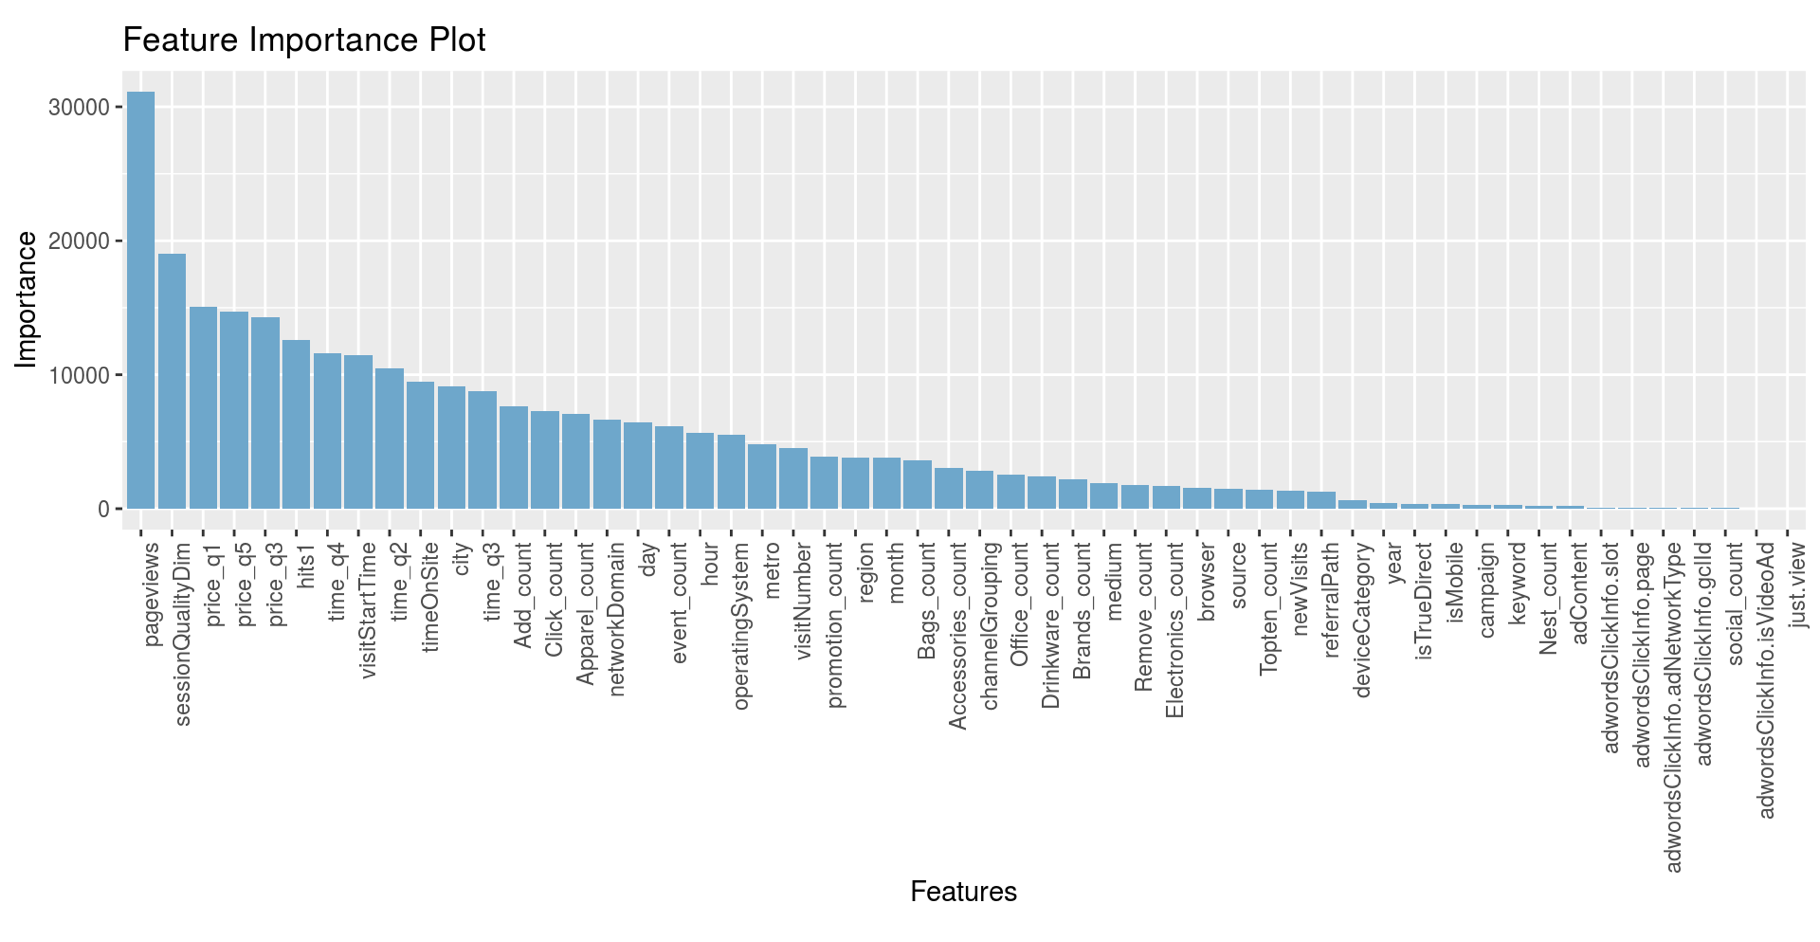
Based on Random Forest, we obtain the feature importance of the data